Selling on Etsy
An Analysis of Etsy Weather Report Stats to help You Make Smart Business Choices
Etsy releases statistics for those who are selling on Etsy in their monthly Weather Report. But a Weather Report for a single month doesn't tell you much until you put it in context with previous months.
So, you can call me crazy, but I decided to spend a week pouring over Etsy sales stats from January 2008 to September 2012 to see what trends I could find.
By the time I was finished, I ended up with bleary eyes, and a few interesting insights into the general direction of sales on www.etsy.com.
All of the numbers I'm going to mention came from the Weather Reports that you can find on the Etsy News Blog.
I went back as far as January 2008 and put all of the monthly data into an Excel spreadsheet to make the numbers easier to compare and analyse (So you'll understand why I might be in need of a big glass of wine right about now!).
An Overview of Etsy Sales Over Time
I started with an overview of Etsy sales by month and year just to get a grasp of the general patterns.
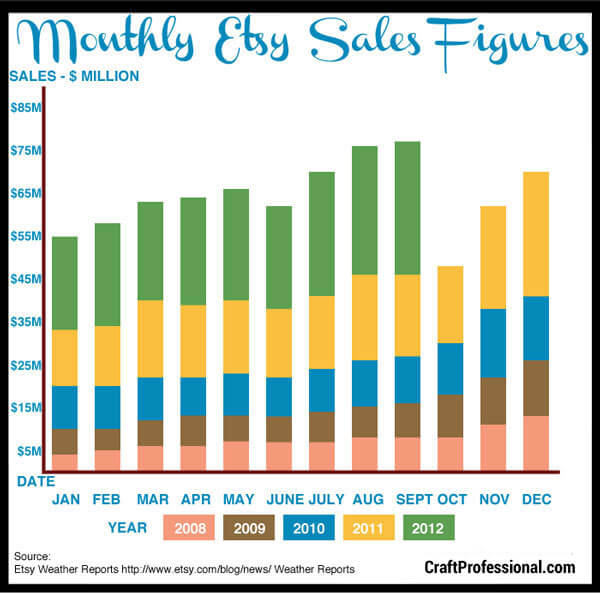
In the chart below, you can see the steady growth of Etsy from 2008 to 2012. In the chart, each year is labeled by color, so 2008 is peach, 2009 is brown, 2010 blue, 2011 is yellow, and 2012 is green. 2012 only goes up to September because that's the data that was available at the time when I made these charts.
I earn a commission for purchases made through links on this page.
To learn more, please see my disclosure.
So the chart show that Etsy has grown quite substantially over the last three and half years, but it also shows some predictable monthly patterns and seasonal rises and dips in sales.
Most notably, every November, sales start to really skyrocket, and they continue to rise through December. Not surprisingly, sales drop off in January and February, and there's a little dip in June also.
One thing that's interesting is that, although sales dip in January, Etsy is growing so much, that by March and April, their total monthly sales figures are back to approximately the levels of the previous holiday season highs.
Unfortunately, it's unclear how that return to top sales figures by early spring will translate into sales for the average Etsy shop.
Although Etsy does provide stats on the number of new members who join each month, they do not provide statistics on the number of active sellers each month, so it's impossible to drill these numbers down to accurately determine the sales numbers for an average Etsy shop.
However, looking at this chart with the numbers Etsy does provide, you can get a good idea of how you might expect your own Etsy shop sales to fluctuate throughout a typical year.
 Monthly Figures for Selling on Etsy 2008-2012
A Hidden Opportunity for Selling on Etsy?
What I did find interesting was a comparison between the relationship of the number of items sold on Etsy versus the number of items listed on Etsy.
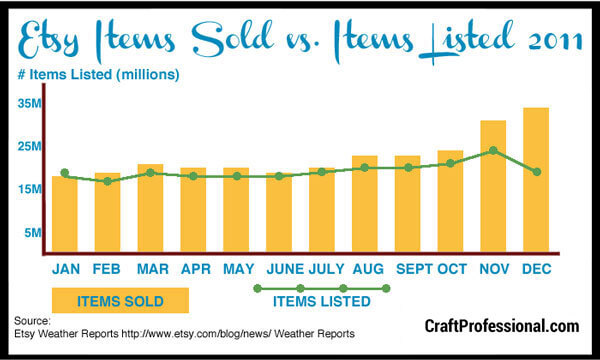
You'll find a chart comparing these two factors for 2011 below. This relationship holds true through other years; I was just too bleary-eyed to chart for all three years.
If you look at the chart below, you can see the yellow bars indicate the number of items sold in any month in 2011 on Etsy, and the green dotted line shows the number of items listed in any month on Etsy.
For most of the year, the number of items listed and the number of items sold are pretty much equal.
However, take a look at November and, more interestingly, December. The number of items listed does not keep up with the number of items sold on Etsy in the top holiday sales months.
In fact, in December, although the number of items sold is still increasing compared to the previous month, the number of items listed really decreases substantially.
Unless I'm missing something, this chart indicates a nice sales opportunity in November and December on Etsy because you have more buyers looking to buy and fewer listed items competing with the items you are selling in your own shop.
What that tells me is, if you are selling on Etsy, it would be wise to really push through the full holiday season, not just November, and be posting new items right through December.
If you look at the article Best Selling Christmas Crafts, you'll see statistics for times when people shop over the holidays, and they mirror the Etsy statistics. That is, people generally start holiday shopping in November but they shop right through December, and that includes online sales.
So if you're going to make the most of sales over the holiday season, it's wise to keep pushing your items on Etsy right through into December.
 Etsy Sellers Items Listed vs. Items Sold 2011
Average Selling Price for Items Sold on Etsy
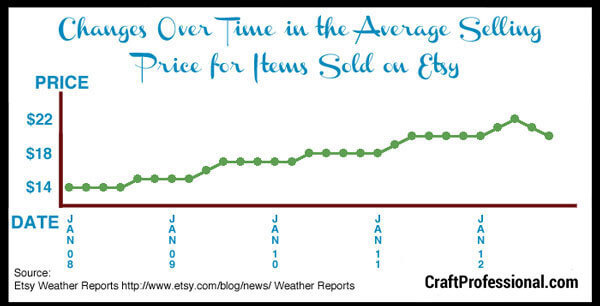
The final chart tracks the changes over time in the average selling price for items that are sold on Etsy.
The Etsy Weather Reports do not actually report the average price per item. I determined the average selling price by dividing the total dollar value of items sold in a month by the number of items sold in the same month.
Keeping the price of handmade items at a profitable level is always an issue, and selling on Etsy is no exception.
From the chart below, you can see the average price of items sold on Etsy around September 2012 is $21.
Now that may seem like a low average price for handmade items. However, it's difficult to comment accurately simply because Etsy doesn't provide details about the types of items sold.
What we can see from the statistics, however, is that the average selling price has increased from an average of $14 per item sold in January 2008 to an average of about $21 per item sold in September 2012.
That is an impressive 50% increase in price over 3 1/2 years - More impressive because it's also a substantial increase in price that occurred through an incredibly difficult economy.
So, in general, we can see the prices are steadily going in the right direction on Etsy.
And, keep in mind, just because $20 is the average selling price doesn't mean that has to be your selling price.
 Average Price of Items Selling on Etsy
That's all my brain can take of Etsy stats! If you want to learn more about Etsy, check out the guide to Selling on Etsy!


New! Comments
Have your say about what you just read! Leave me a comment in the box below.